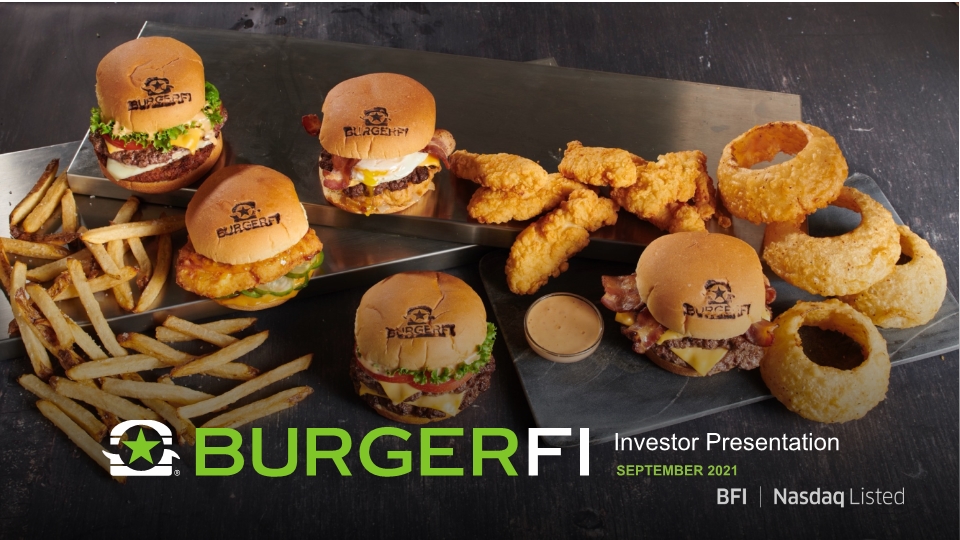

Investor Presentation SEPTEMBER 2021
Disclaimer FORWARD-LOOKING STATEMENTS This Presentation may contain "forward-looking statements" as defined in the Private Securities Litigation Reform Act of 1995, including statements relating to BurgerFi International, Inc.’s (“BurgerFi” or the “Company”) estimates of its future business outlook, store opening plans, same store sales and restaurant operating margin growth plans, prospects or financial results. Forward-looking statements generally can be identified by words such as "anticipates," "believes," "estimates," "expects," "intends," "plans," "predicts," "projects," "will be," "will continue," "will likely result," and similar expressions. These forward-looking statements are based on current expectations and assumptions that are subject to risks and uncertainties, which could cause our actual results to differ materially from those reflected in the forward-looking statements. Factors that could cause or contribute to such differences include, but are not limited to, those discussed in our Annual Report on Form 10-K for the year ended December 31, 2020 and those discussed in other documents we file with the Securities and Exchange Commission. All subsequent written and oral forward-looking statements attributable to BurgerFi or persons acting on BurgerFi’s behalf are expressly qualified in their entirety by the cautionary statements included in this presentation. We undertake no obligation to revise or publicly release the results of any revision to these forward-looking statements, except as required by law. Given these risks and uncertainties, readers are cautioned not to place undue reliance on such forward-looking statements. NON-GAAP FINANCIAL MEASURES For discussion and reconciliation of non-GAAP financial measures, see slides 23-24 of this presentation. 2
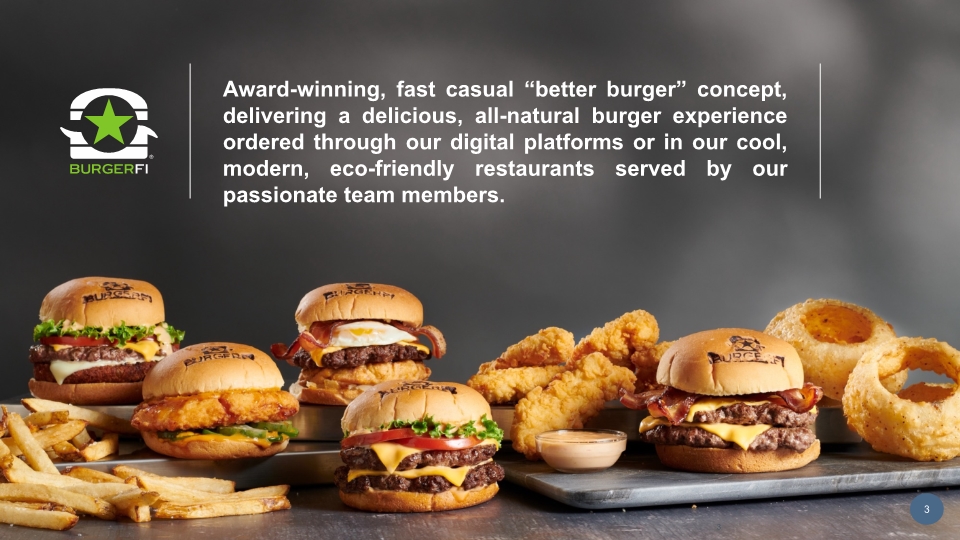
3 Award-winning, fast casual “better burger” concept, delivering a delicious, all-natural burger experience ordered through our digital platforms or in our cool, modern, eco-friendly restaurants served by our passionate team members. 3 3
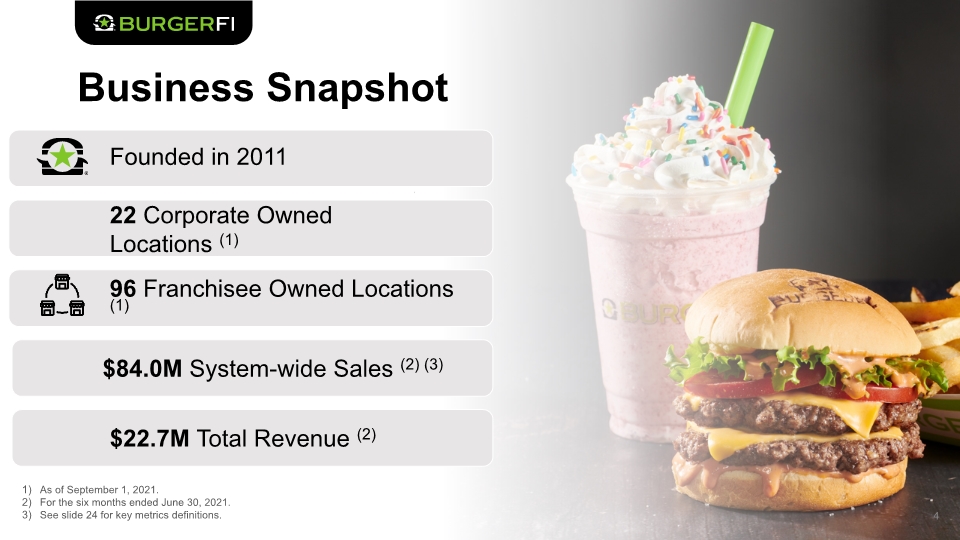
96 Franchisee Owned Locations (1) 22 Corporate Owned Locations (1) Business Snapshot 4 As of September 1, 2021. For the six months ended June 30, 2021. See slide 24 for key metrics definitions. Founded in 2011 $84.0M System-wide Sales (2) (3) $22.7M Total Revenue (2)
5
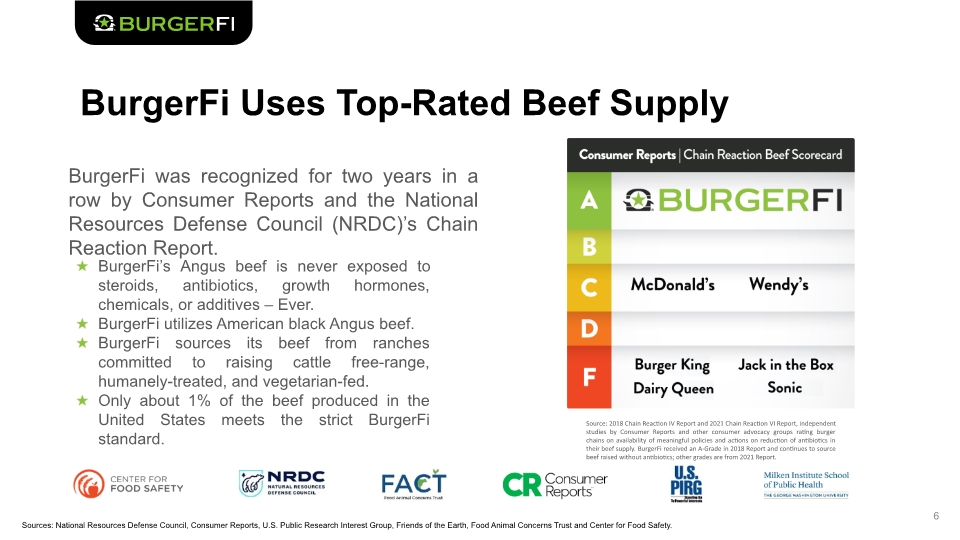
BurgerFi Uses Top-Rated Beef Supply 6 Source: 2018 Chain Reaction IV Report and 2021 Chain Reaction VI Report, independent studies by Consumer Reports and other consumer advocacy groups rating burger chains on availability of meaningful policies and actions on reduction of antibiotics in their beef supply. BurgerFi received an A-Grade in 2018 Report and continues to source beef raised without antibiotics; other grades are from 2021 Report. Sources: National Resources Defense Council, Consumer Reports, U.S. Public Research Interest Group, Friends of the Earth, Food Animal Concerns Trust and Center for Food Safety. BurgerFi’s Angus beef is never exposed to steroids, antibiotics, growth hormones, chemicals, or additives – Ever. BurgerFi utilizes American black Angus beef. BurgerFi sources its beef from ranches committed to raising cattle free-range, humanely-treated, and vegetarian-fed. Only about 1% of the beef produced in the United States meets the strict BurgerFi standard. BurgerFi was recognized for two years in a row by Consumer Reports and the National Resources Defense Council (NRDC)’s Chain Reaction Report.
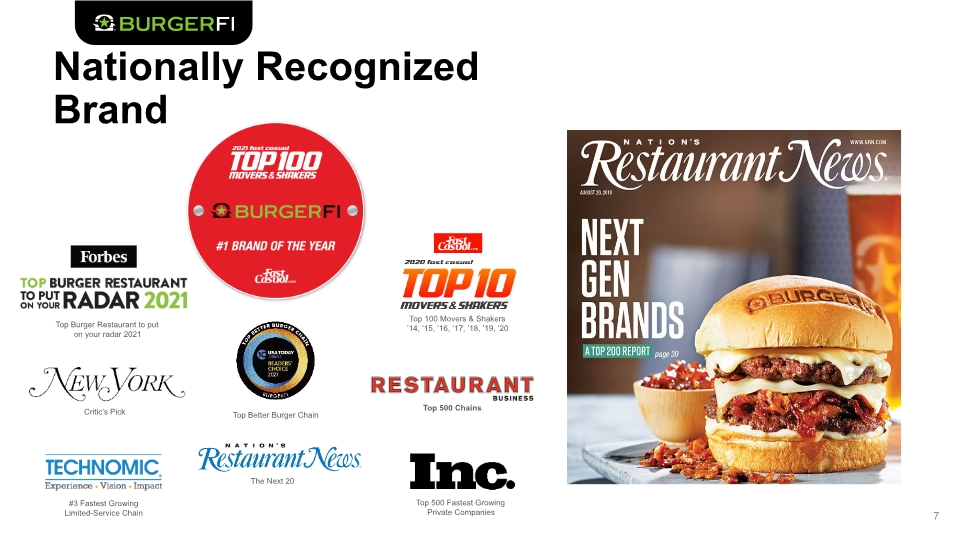
Nationally Recognized Brand 7 Top 500 Fastest Growing Private Companies #3 Fastest Growing Limited-Service Chain Top 100 Movers & Shakers ’14, ‘15, ’16, ‘17, ’18, ’19, ‘20 Top 500 Chains Top Burger Restaurant to put on your radar 2021 Top Better Burger Chain Critic’s Pick The Next 20
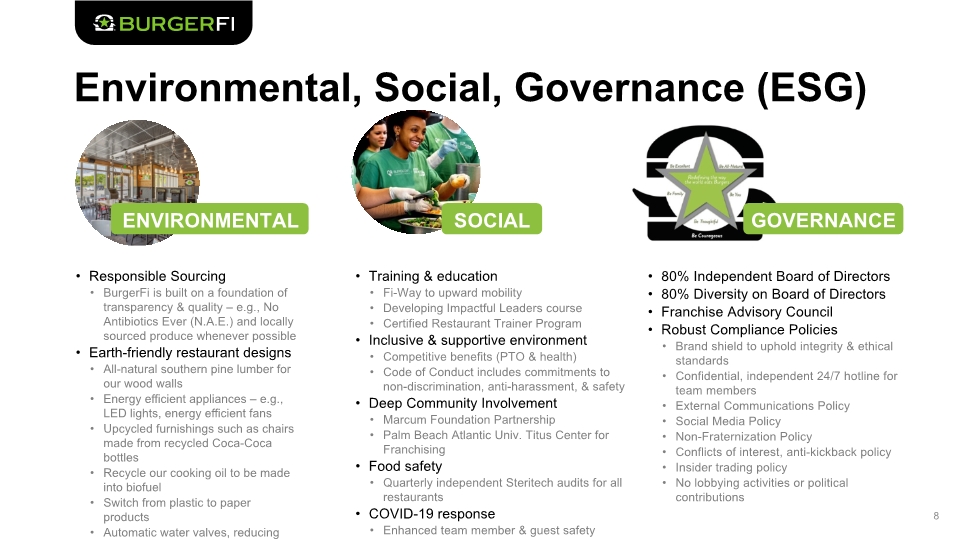
Environmental, Social, Governance (ESG) 8 Environmental COPY COPY COPY Responsible Sourcing BurgerFi is built on a foundation of transparency & quality – e.g., No Antibiotics Ever (N.A.E.) and locally sourced produce whenever possible Earth-friendly restaurant designs All-natural southern pine lumber for our wood walls Energy efficient appliances – e.g., LED lights, energy efficient fans Upcycled furnishings such as chairs made from recycled Coca-Coca bottles Recycle our cooking oil to be made into biofuel Switch from plastic to paper products Automatic water valves, reducing annual water consumption Training & education Fi-Way to upward mobility Developing Impactful Leaders course Certified Restaurant Trainer Program Inclusive & supportive environment Competitive benefits (PTO & health) Code of Conduct includes commitments to non-discrimination, anti-harassment, & safety Deep Community Involvement Marcum Foundation Partnership Palm Beach Atlantic Univ. Titus Center for Franchising Food safety Quarterly independent Steritech audits for all restaurants COVID-19 response Enhanced team member & guest safety measures 80% Independent Board of Directors 80% Diversity on Board of Directors Franchise Advisory Council Robust Compliance Policies Brand shield to uphold integrity & ethical standards Confidential, independent 24/7 hotline for team members External Communications Policy Social Media Policy Non-Fraternization Policy Conflicts of interest, anti-kickback policy Insider trading policy No lobbying activities or political contributions ENVIRONMENTAL SOCIAL GOVERNANCE
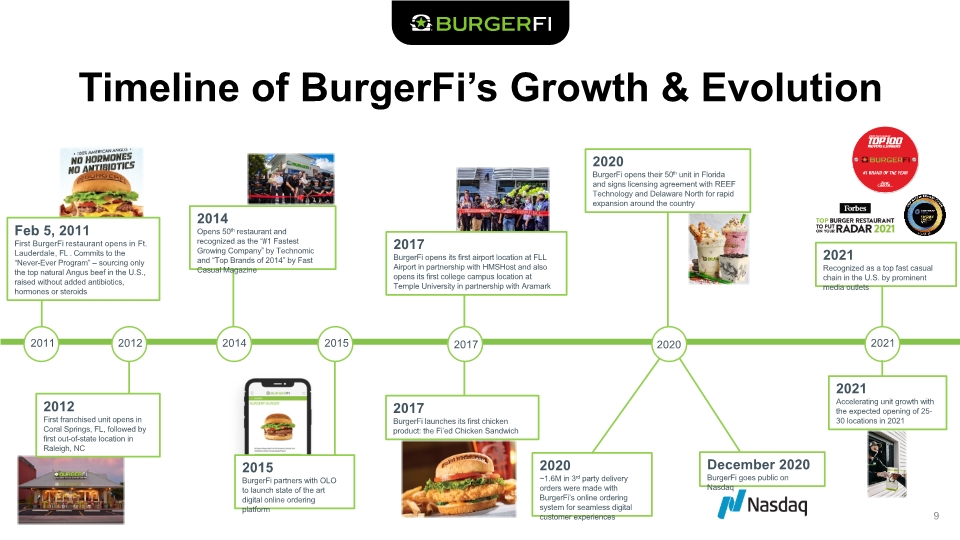
Timeline of BurgerFi’s Growth & Evolution 9 Feb 5, 2011 First BurgerFi restaurant opens in Ft. Lauderdale, FL . Commits to the “Never-Ever Program” – sourcing only the top natural Angus beef in the U.S., raised without added antibiotics, hormones or steroids 2011 2012 2014 Opens 50th restaurant and recognized as the “#1 Fastest Growing Company” by Technomic and “Top Brands of 2014” by Fast Casual Magazine 2014 2015 2015 BurgerFi partners with OLO to launch state of the art digital online ordering platform 2017 2017 BurgerFi opens its first airport location at FLL Airport in partnership with HMSHost and also opens its first college campus location at Temple University in partnership with Aramark 2017 BurgerFi launches its first chicken product: the Fi’ed Chicken Sandwich 2020 ~1.6M in 3rd party delivery orders were made with BurgerFi’s online ordering system for seamless digital customer experiences 2021 2020 BurgerFi opens their 50th unit in Florida and signs licensing agreement with REEF Technology and Delaware North for rapid expansion around the country December 2020 BurgerFi goes public on Nasdaq 2021 Accelerating unit growth with the expected opening of 25-30 locations in 2021 2021 Recognized as a top fast casual chain in the U.S. by prominent media outlets 2012 First franchised unit opens in Coral Springs, FL, followed by first out-of-state location in Raleigh, NC 2020
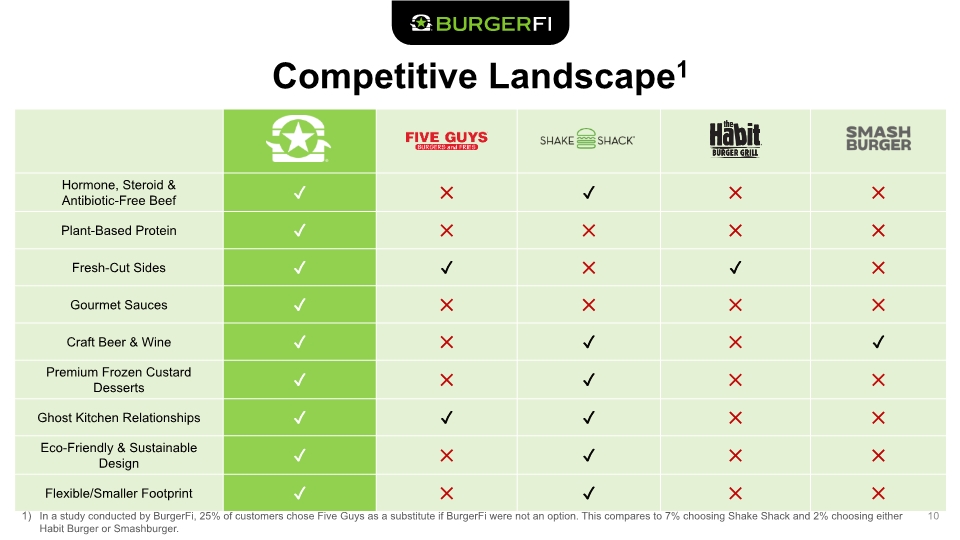
Competitive Landscape1 10 In a study conducted by BurgerFi, 25% of customers chose Five Guys as a substitute if BurgerFi were not an option. This compares to 7% choosing Shake Shack and 2% choosing either Habit Burger or Smashburger.

Experienced Executive Leadership Team 11 Julio Ramirez Chief Executive Officer Jim Esposito Chief Operating Officer Ross Goldstein Chief Legal Officer Henry Gonzalez Chief Marketing Officer Michael Rabinovitch Chief Financial Officer Karl Goodhew Chief Technology Officer Over 40 years of experience in the multi-unit restaurant industry Founded Jem Global Inc. and co-owner of Giordino Gourmet Salads Previously with Burger King for over 25 years Over 25 years of extensive financial experience with best-in-class public companies such as Tech Data, Office Depot, Mayors Jewelers and Claire’s Stores QSR-industry veteran with over 20 years of experience at Burger King, Panera Bread and Papa Gino’s Over 20 years of legal experience, specializing in franchising, real estate, general corporate and business transactions Over 25 years of food and retail experience working with leading national and global brands like Burger King, McDonald’s, Walmart, Home Depot and Infiniti Over 15 years of software development experience with Fortune 500 companies Chef Paul Griffin Chief Culinary Officer Over 30 years of experience and classically trained chef from the Philadelphia Restaurant School
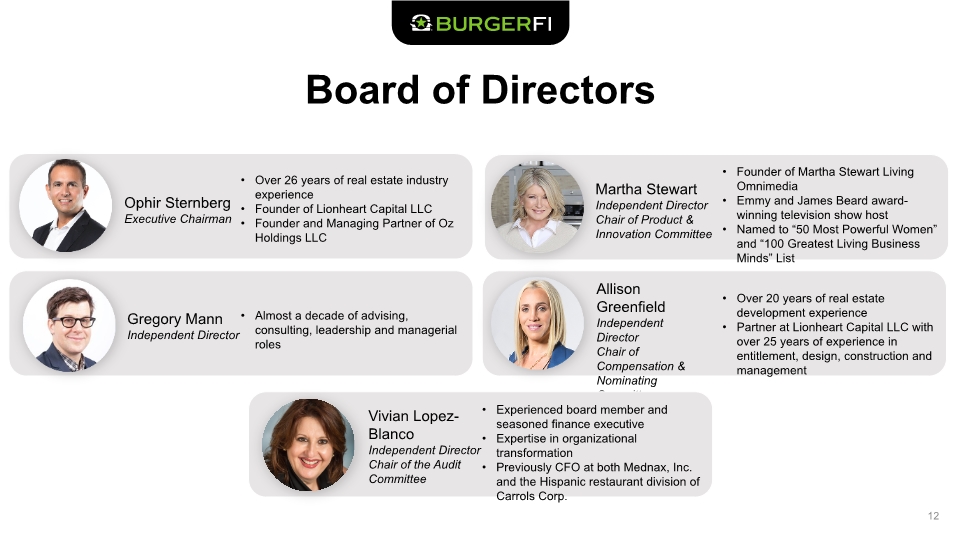
Board of Directors 12 Ophir Sternberg Executive Chairman Allison Greenfield Independent Director Chair of Compensation & Nominating Committee Martha Stewart Independent Director Chair of Product & Innovation Committee Gregory Mann Independent Director Over 26 years of real estate industry experience Founder of Lionheart Capital LLC Founder and Managing Partner of Oz Holdings LLC Founder of Martha Stewart Living Omnimedia Emmy and James Beard award-winning television show host Named to “50 Most Powerful Women” and “100 Greatest Living Business Minds” List Almost a decade of advising, consulting, leadership and managerial roles Over 20 years of real estate development experience Partner at Lionheart Capital LLC with over 25 years of experience in entitlement, design, construction and management Vivian Lopez-Blanco Independent Director Chair of the Audit Committee Experienced board member and seasoned finance executive Expertise in organizational transformation Previously CFO at both Mednax, Inc. and the Hispanic restaurant division of Carrols Corp.

Growth Strategy 13
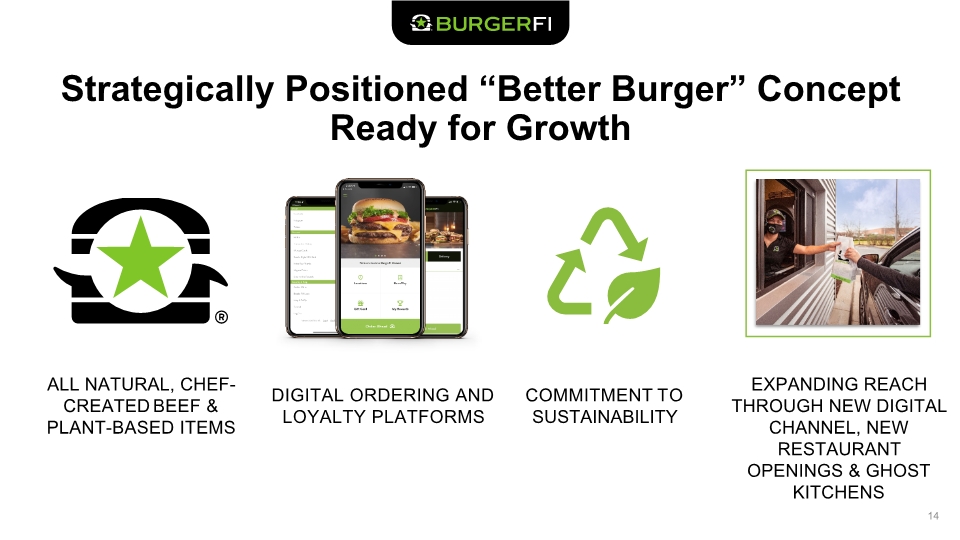
Strategically Positioned “Better Burger” Concept Ready for Growth 14 ALL NATURAL, CHEF-CREATED BEEF & PLANT-BASED ITEMS COMMITMENT TO SUSTAINABILITY EXPANDING REACH THROUGH NEW DIGITAL CHANNEL, NEW RESTAURANT OPENINGS & GHOST KITCHENS DIGITAL ORDERING AND LOYALTY PLATFORMS
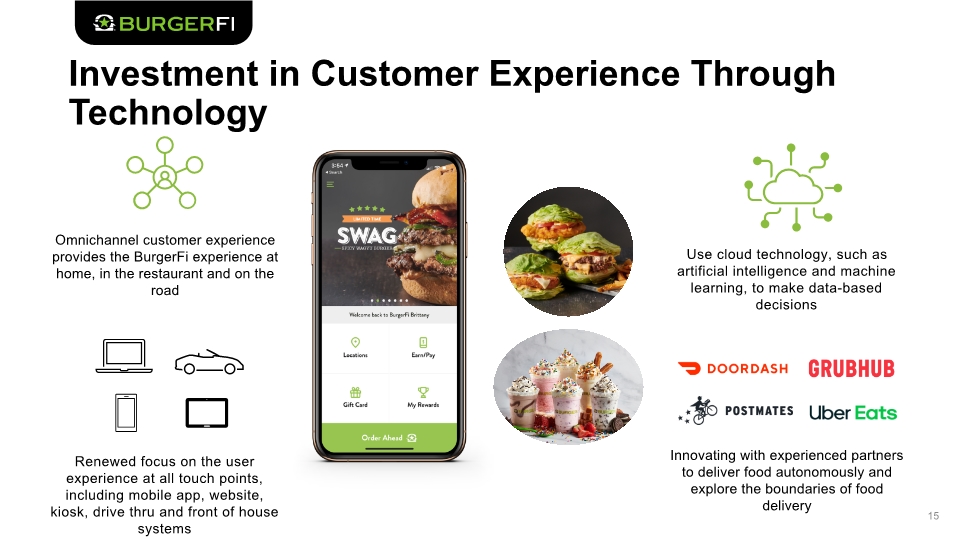
Investment in Customer Experience Through Technology 15 Omnichannel customer experience provides the BurgerFi experience at home, in the restaurant and on the road Renewed focus on the user experience at all touch points, including mobile app, website, kiosk, drive thru and front of house systems Use cloud technology, such as artificial intelligence and machine learning, to make data-based decisions Innovating with experienced partners to deliver food autonomously and explore the boundaries of food delivery
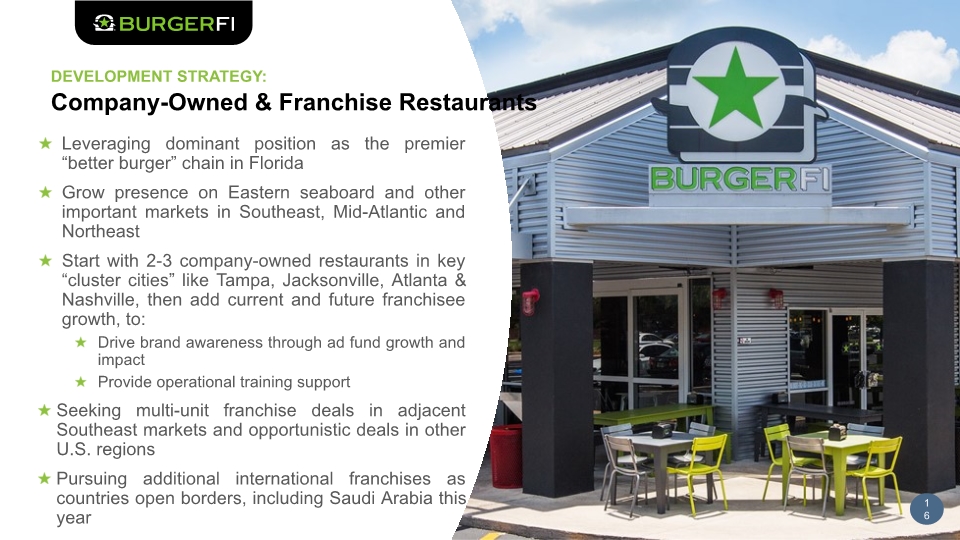
DEVELOPMENT STRATEGY: Company-Owned & Franchise Restaurants Leveraging dominant position as the premier “better burger” chain in Florida Grow presence on Eastern seaboard and other important markets in Southeast, Mid-Atlantic and Northeast Start with 2-3 company-owned restaurants in key “cluster cities” like Tampa, Jacksonville, Atlanta & Nashville, then add current and future franchisee growth, to: Drive brand awareness through ad fund growth and impact Provide operational training support Seeking multi-unit franchise deals in adjacent Southeast markets and opportunistic deals in other U.S. regions Pursuing additional international franchises as countries open borders, including Saudi Arabia this year 16
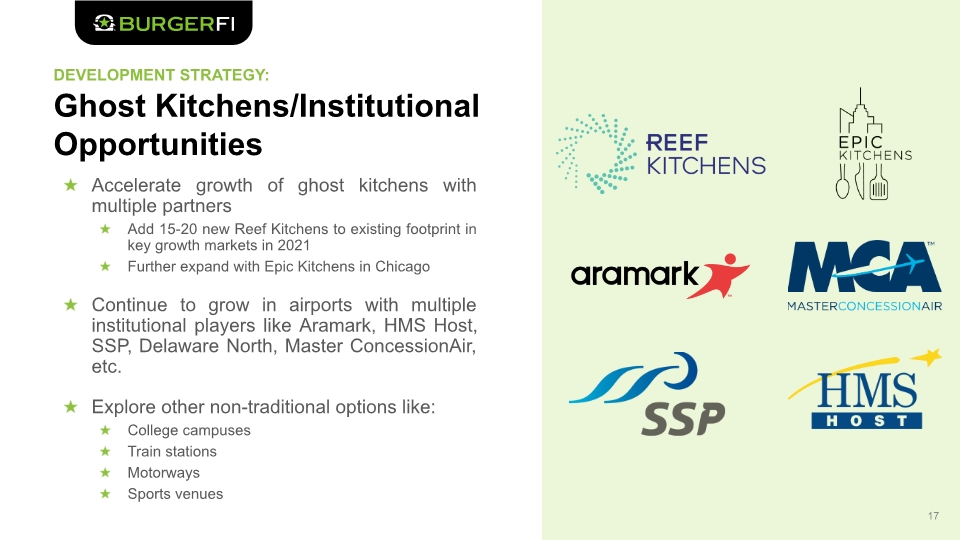
DEVELOPMENT STRATEGY: Ghost Kitchens/Institutional Opportunities Accelerate growth of ghost kitchens with multiple partners Add 15-20 new Reef Kitchens to existing footprint in key growth markets in 2021 Further expand with Epic Kitchens in Chicago Continue to grow in airports with multiple institutional players like Aramark, HMS Host, SSP, Delaware North, Master ConcessionAir, etc. Explore other non-traditional options like: College campuses Train stations Motorways Sports venues 17
Latest Financial Results 18
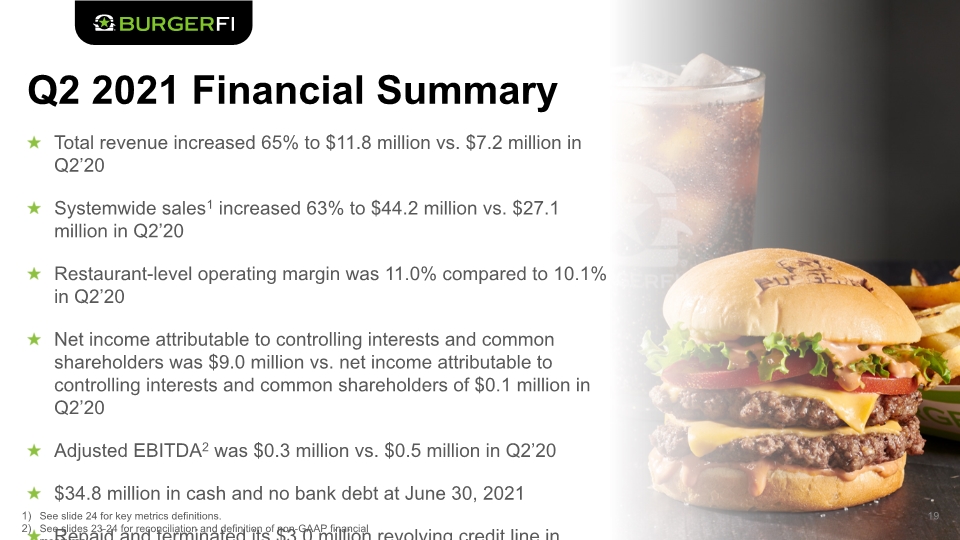
Q2 2021 Financial Summary Total revenue increased 65% to $11.8 million vs. $7.2 million in Q2’20 Systemwide sales1 increased 63% to $44.2 million vs. $27.1 million in Q2’20 Restaurant-level operating margin was 11.0% compared to 10.1% in Q2’20 Net income attributable to controlling interests and common shareholders was $9.0 million vs. net income attributable to controlling interests and common shareholders of $0.1 million in Q2’20 Adjusted EBITDA2 was $0.3 million vs. $0.5 million in Q2’20 $34.8 million in cash and no bank debt at June 30, 2021 Repaid and terminated its $3.0 million revolving credit line in February 2021 19 See slide 24 for key metrics definitions. See slides 23-24 for reconciliation and definition of non-GAAP financial measures.
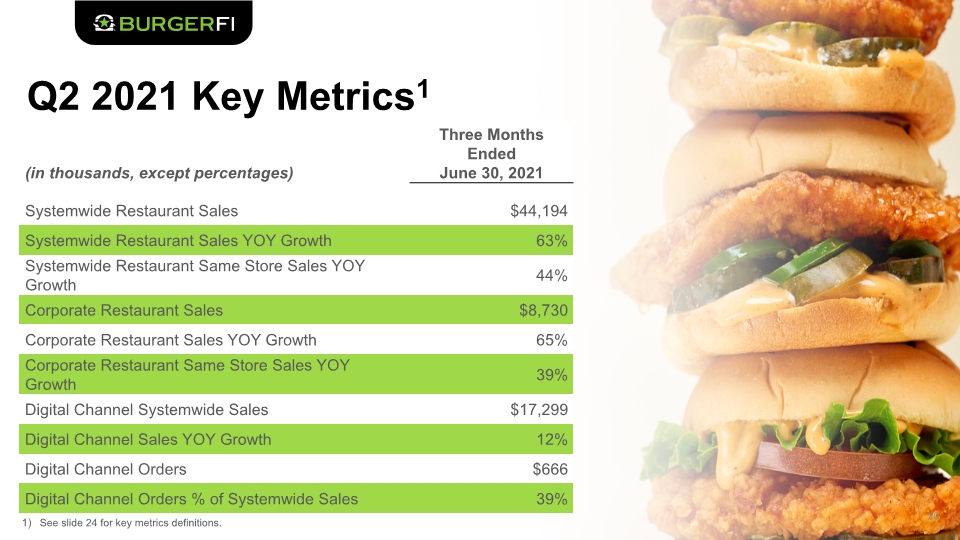
Q2 2021 Key Metrics1 20 Please make a similar fade away image like this, but I don’t want it to have an identical image to slide 5 See slide 24 for key metrics definitions.
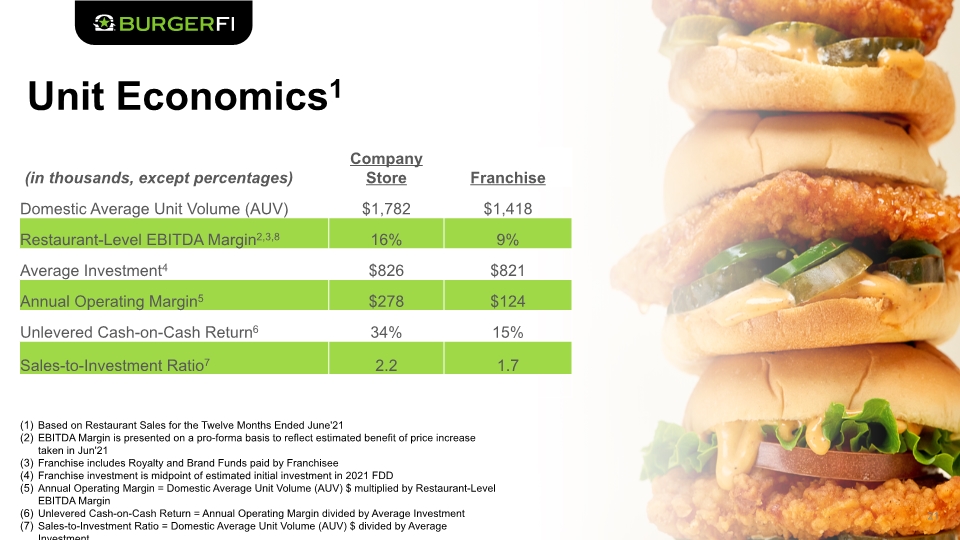
Unit Economics1 21 Please make a similar fade away image like this, but I don’t want it to have an identical image to slide 5
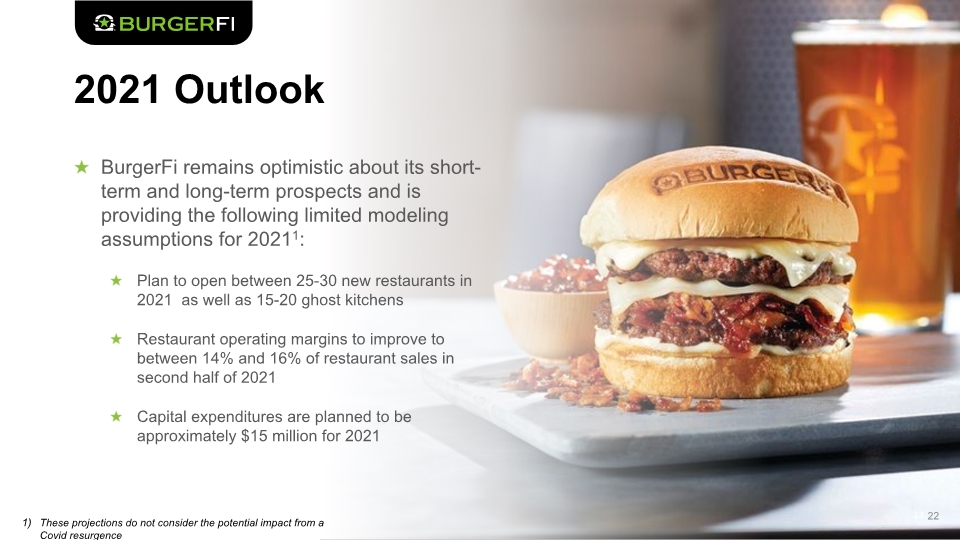
2021 Outlook 22 Please make a similar fade away image like this, but I don’t want it to have an identical image to slide 5 BurgerFi remains optimistic about its short-term and long-term prospects and is providing the following limited modeling assumptions for 20211: Plan to open between 25-30 new restaurants in 2021 as well as 15-20 ghost kitchens Restaurant operating margins to improve to between 14% and 16% of restaurant sales in second half of 2021 Capital expenditures are planned to be approximately $15 million for 2021 These projections do not consider the potential impact from a Covid resurgence
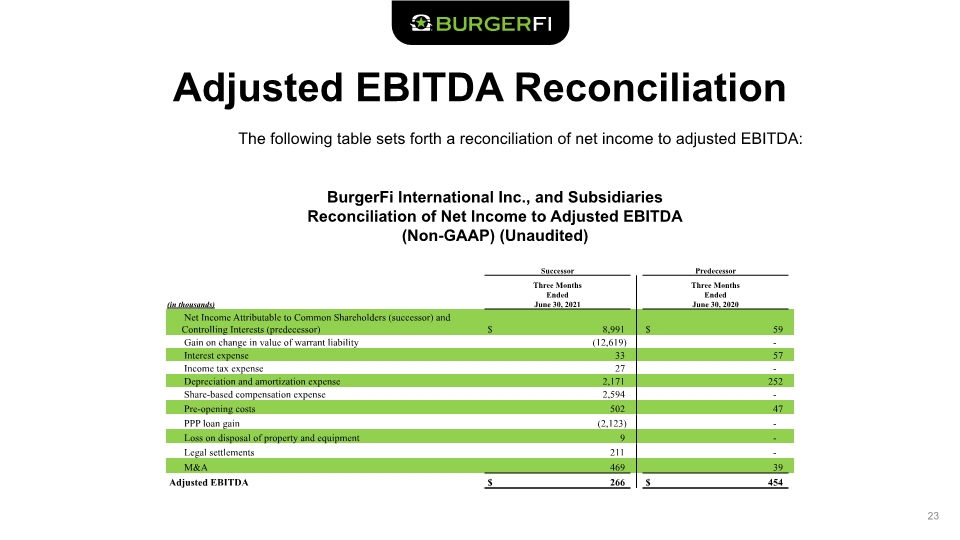
Adjusted EBITDA Reconciliation 23 The following table sets forth a reconciliation of net income to adjusted EBITDA: BurgerFi International Inc., and Subsidiaries Reconciliation of Net Income to Adjusted EBITDA (Non-GAAP) (Unaudited)
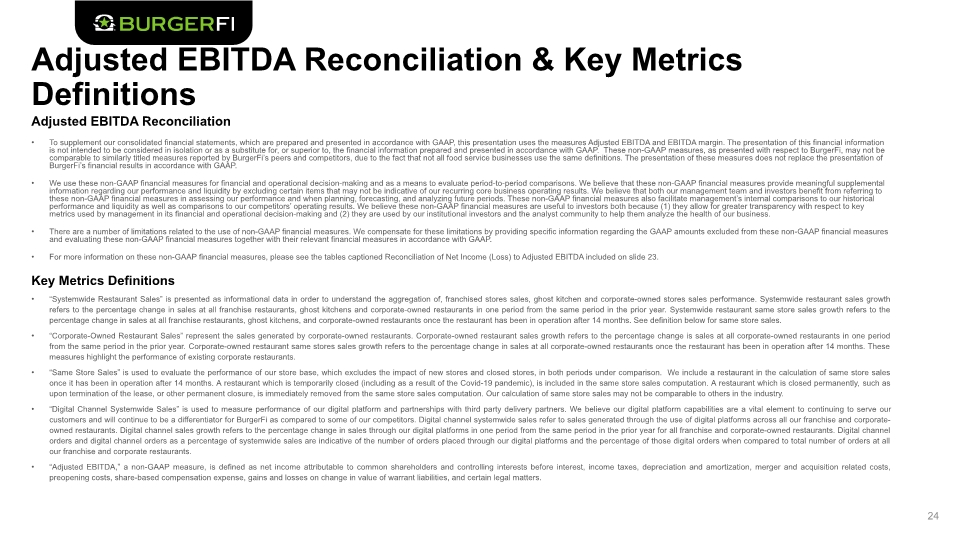
Adjusted EBITDA Reconciliation & Key Metrics Definitions Adjusted EBITDA Reconciliation To supplement our consolidated financial statements, which are prepared and presented in accordance with GAAP, this presentation uses the measures Adjusted EBITDA and EBITDA margin. The presentation of this financial information is not intended to be considered in isolation or as a substitute for, or superior to, the financial information prepared and presented in accordance with GAAP. These non-GAAP measures, as presented with respect to BurgerFi, may not be comparable to similarly titled measures reported by BurgerFi’s peers and competitors, due to the fact that not all food service businesses use the same definitions. The presentation of these measures does not replace the presentation of BurgerFi’s financial results in accordance with GAAP. We use these non-GAAP financial measures for financial and operational decision-making and as a means to evaluate period-to-period comparisons. We believe that these non-GAAP financial measures provide meaningful supplemental information regarding our performance and liquidity by excluding certain items that may not be indicative of our recurring core business operating results. We believe that both our management team and investors benefit from referring to these non-GAAP financial measures in assessing our performance and when planning, forecasting, and analyzing future periods. These non-GAAP financial measures also facilitate management’s internal comparisons to our historical performance and liquidity as well as comparisons to our competitors’ operating results. We believe these non-GAAP financial measures are useful to investors both because (1) they allow for greater transparency with respect to key metrics used by management in its financial and operational decision-making and (2) they are used by our institutional investors and the analyst community to help them analyze the health of our business. There are a number of limitations related to the use of non-GAAP financial measures. We compensate for these limitations by providing specific information regarding the GAAP amounts excluded from these non-GAAP financial measures and evaluating these non-GAAP financial measures together with their relevant financial measures in accordance with GAAP. For more information on these non-GAAP financial measures, please see the tables captioned Reconciliation of Net Income (Loss) to Adjusted EBITDA included on slide 23. Key Metrics Definitions “Systemwide Restaurant Sales” is presented as informational data in order to understand the aggregation of, franchised stores sales, ghost kitchen and corporate-owned stores sales performance. Systemwide restaurant sales growth refers to the percentage change in sales at all franchise restaurants, ghost kitchens and corporate-owned restaurants in one period from the same period in the prior year. Systemwide restaurant same store sales growth refers to the percentage change in sales at all franchise restaurants, ghost kitchens, and corporate-owned restaurants once the restaurant has been in operation after 14 months. See definition below for same store sales. “Corporate-Owned Restaurant Sales” represent the sales generated by corporate-owned restaurants. Corporate-owned restaurant sales growth refers to the percentage change is sales at all corporate-owned restaurants in one period from the same period in the prior year. Corporate-owned restaurant same stores sales growth refers to the percentage change in sales at all corporate-owned restaurants once the restaurant has been in operation after 14 months. These measures highlight the performance of existing corporate restaurants. “Same Store Sales” is used to evaluate the performance of our store base, which excludes the impact of new stores and closed stores, in both periods under comparison. We include a restaurant in the calculation of same store sales once it has been in operation after 14 months. A restaurant which is temporarily closed (including as a result of the Covid-19 pandemic), is included in the same store sales computation. A restaurant which is closed permanently, such as upon termination of the lease, or other permanent closure, is immediately removed from the same store sales computation. Our calculation of same store sales may not be comparable to others in the industry. “Digital Channel Systemwide Sales” is used to measure performance of our digital platform and partnerships with third party delivery partners. We believe our digital platform capabilities are a vital element to continuing to serve our customers and will continue to be a differentiator for BurgerFi as compared to some of our competitors. Digital channel systemwide sales refer to sales generated through the use of digital platforms across all our franchise and corporate-owned restaurants. Digital channel sales growth refers to the percentage change in sales through our digital platforms in one period from the same period in the prior year for all franchise and corporate-owned restaurants. Digital channel orders and digital channel orders as a percentage of systemwide sales are indicative of the number of orders placed through our digital platforms and the percentage of those digital orders when compared to total number of orders at all our franchise and corporate restaurants. “Adjusted EBITDA,” a non-GAAP measure, is defined as net income attributable to common shareholders and controlling interests before interest, income taxes, depreciation and amortization, merger and acquisition related costs, preopening costs, share-based compensation expense, gains and losses on change in value of warrant liabilities, and certain legal matters. 24
Key Takeaways 25
Investment Highlights Award-winning, “better burger” concept that is well positioned for expansion with a strong balance sheet plus an experienced and motivated senior management team Significant runway for growth coming out of the pandemic, expecting to open approximately 30 new restaurants and approximately 15-20 new ghost kitchens in 2021 Unique expansion opportunities to grow the BurgerFi brand outside of restaurants, including ghost kitchens and non-traditional venues Tech-enabled ordering system and loyalty platform to meet the evolving preferences of today’s consumer, ultimately driving revenue growth Named a top fast casual chain in the U.S. by three prominent media outlets in 2021 Recognized by multiple food and consumer institutions for best-in-class quality of ingredients 26

Contact Us Investor Relations Contact Lynne Collier (949) 574-3860 IR-BFI@icrinc.com